Air quality meter comparison: Sophisticated vs. cheap
In this post, we compare an expensive air quality monitor with a cheap model from Amazon
Recently, a friend asked me about a cheaper air quality model that he got from Amazon compared to the air-Q, which is the monitor I use. It is more expensive, with the base model starting at over 300 euros and the Pro model at over 500 euros. I'm not writing exact prices here, as they do vary. You can check the current price on their shop.
Let's put it to the test
I compared the two on a day with good air quality, but found the results not informative, as they both did not have to work hard and detect pollutants.
A day that had medium to high air pollution would be best for the test. So after a few days, the time had come.
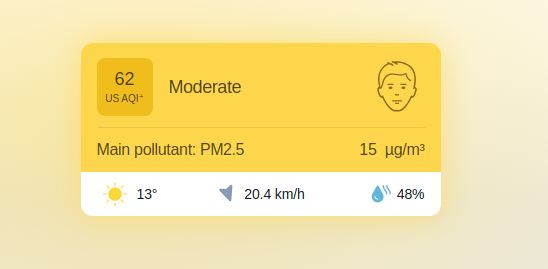
To have a reference point, I went to iqair.com and checked for the air quality in my city that day. The website aggregates data from three monitoring stations, one of which is near my home.
This was the overall air quality index for that day:
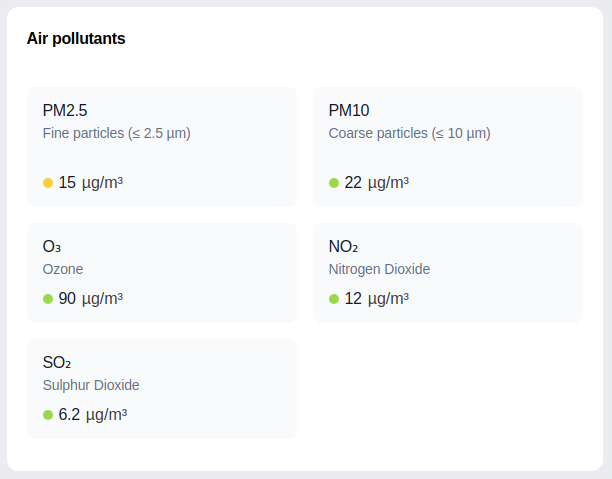
And here's a breakdown of the air pollutants:
When taking a look at both devices with closed windows, the measuring data was pretty similar. I didn't expect large deviations at this point, so I was not surprised.
Let's open the windows
I was more curious about how the devices would perform when the windows were open and bad air could come in.
Both devices were placed near the window, but not exactly on the windowsill, in order to measure the air of the room with the new air coming in and also not to disturb the sensors (which are calibrated for indoor use) with too much air movement from outside. These are indoor devices after all, and from what I know about the air-Q, the biochemical sensors can get confused when used outdoors.
Working with limit values
As a second reference point, I opened a page on the air-Q website that lists limit values for different gases, particles and pollutants in the air we breathe. These limit values are determined by the EU, the WHO or Federal Environment Agencies and serve as a good indication of whether the air contains too much of a pollutant.
One advantage of the air-Q is that it has the limit values coded into the software. So when a value is exceeded, the dashboard on the web app or the mobile app displays that value in red.
On the other device, you have to check manually whether a limit value is exceeded, at least if you want to work with the limit values on the air-Q website.
When the air-Q already turns red with some values, especially fine dust PM 1 and PM 2.5, the Chinese device still smiles at you as if there was no problem. They're probably used to much higher values. 😄
Comparing the measuring data
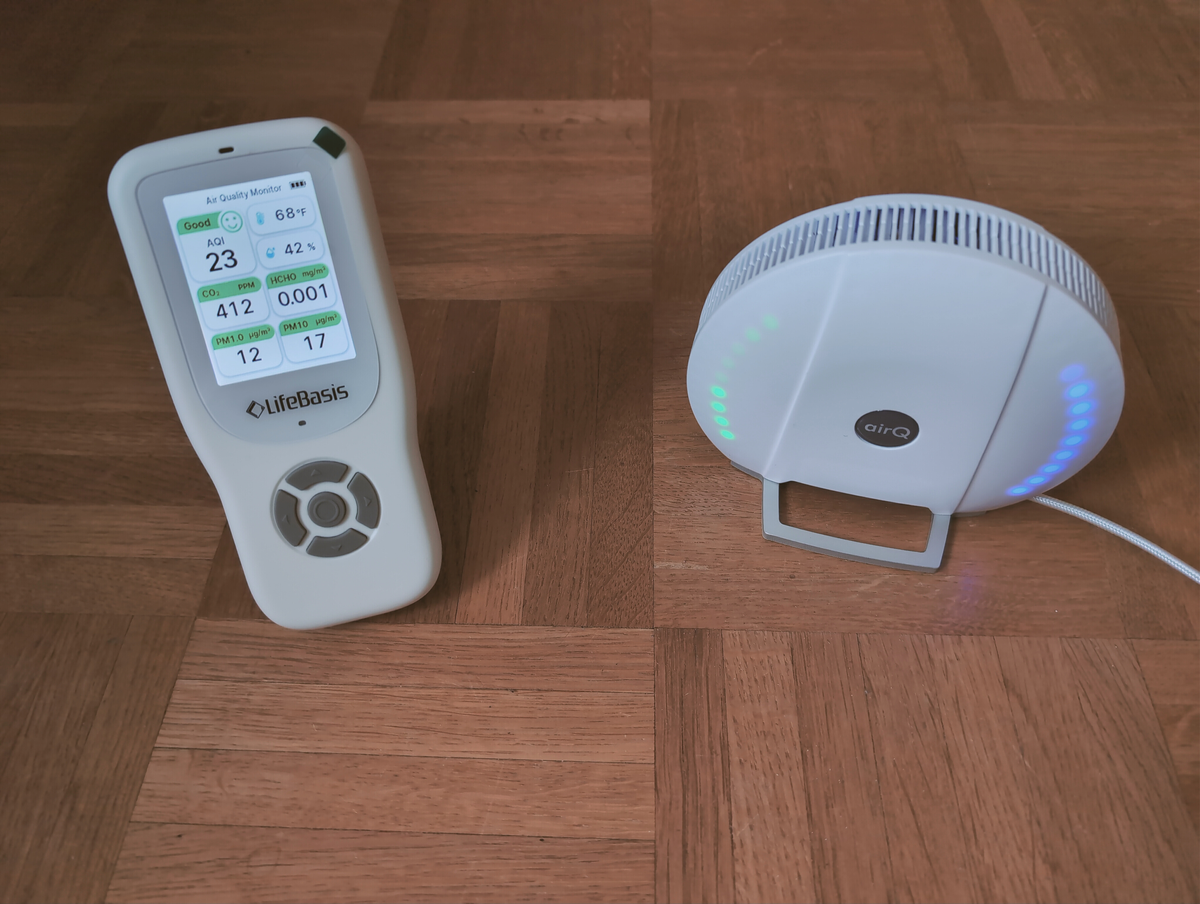
Let's take a look at the first set of data:
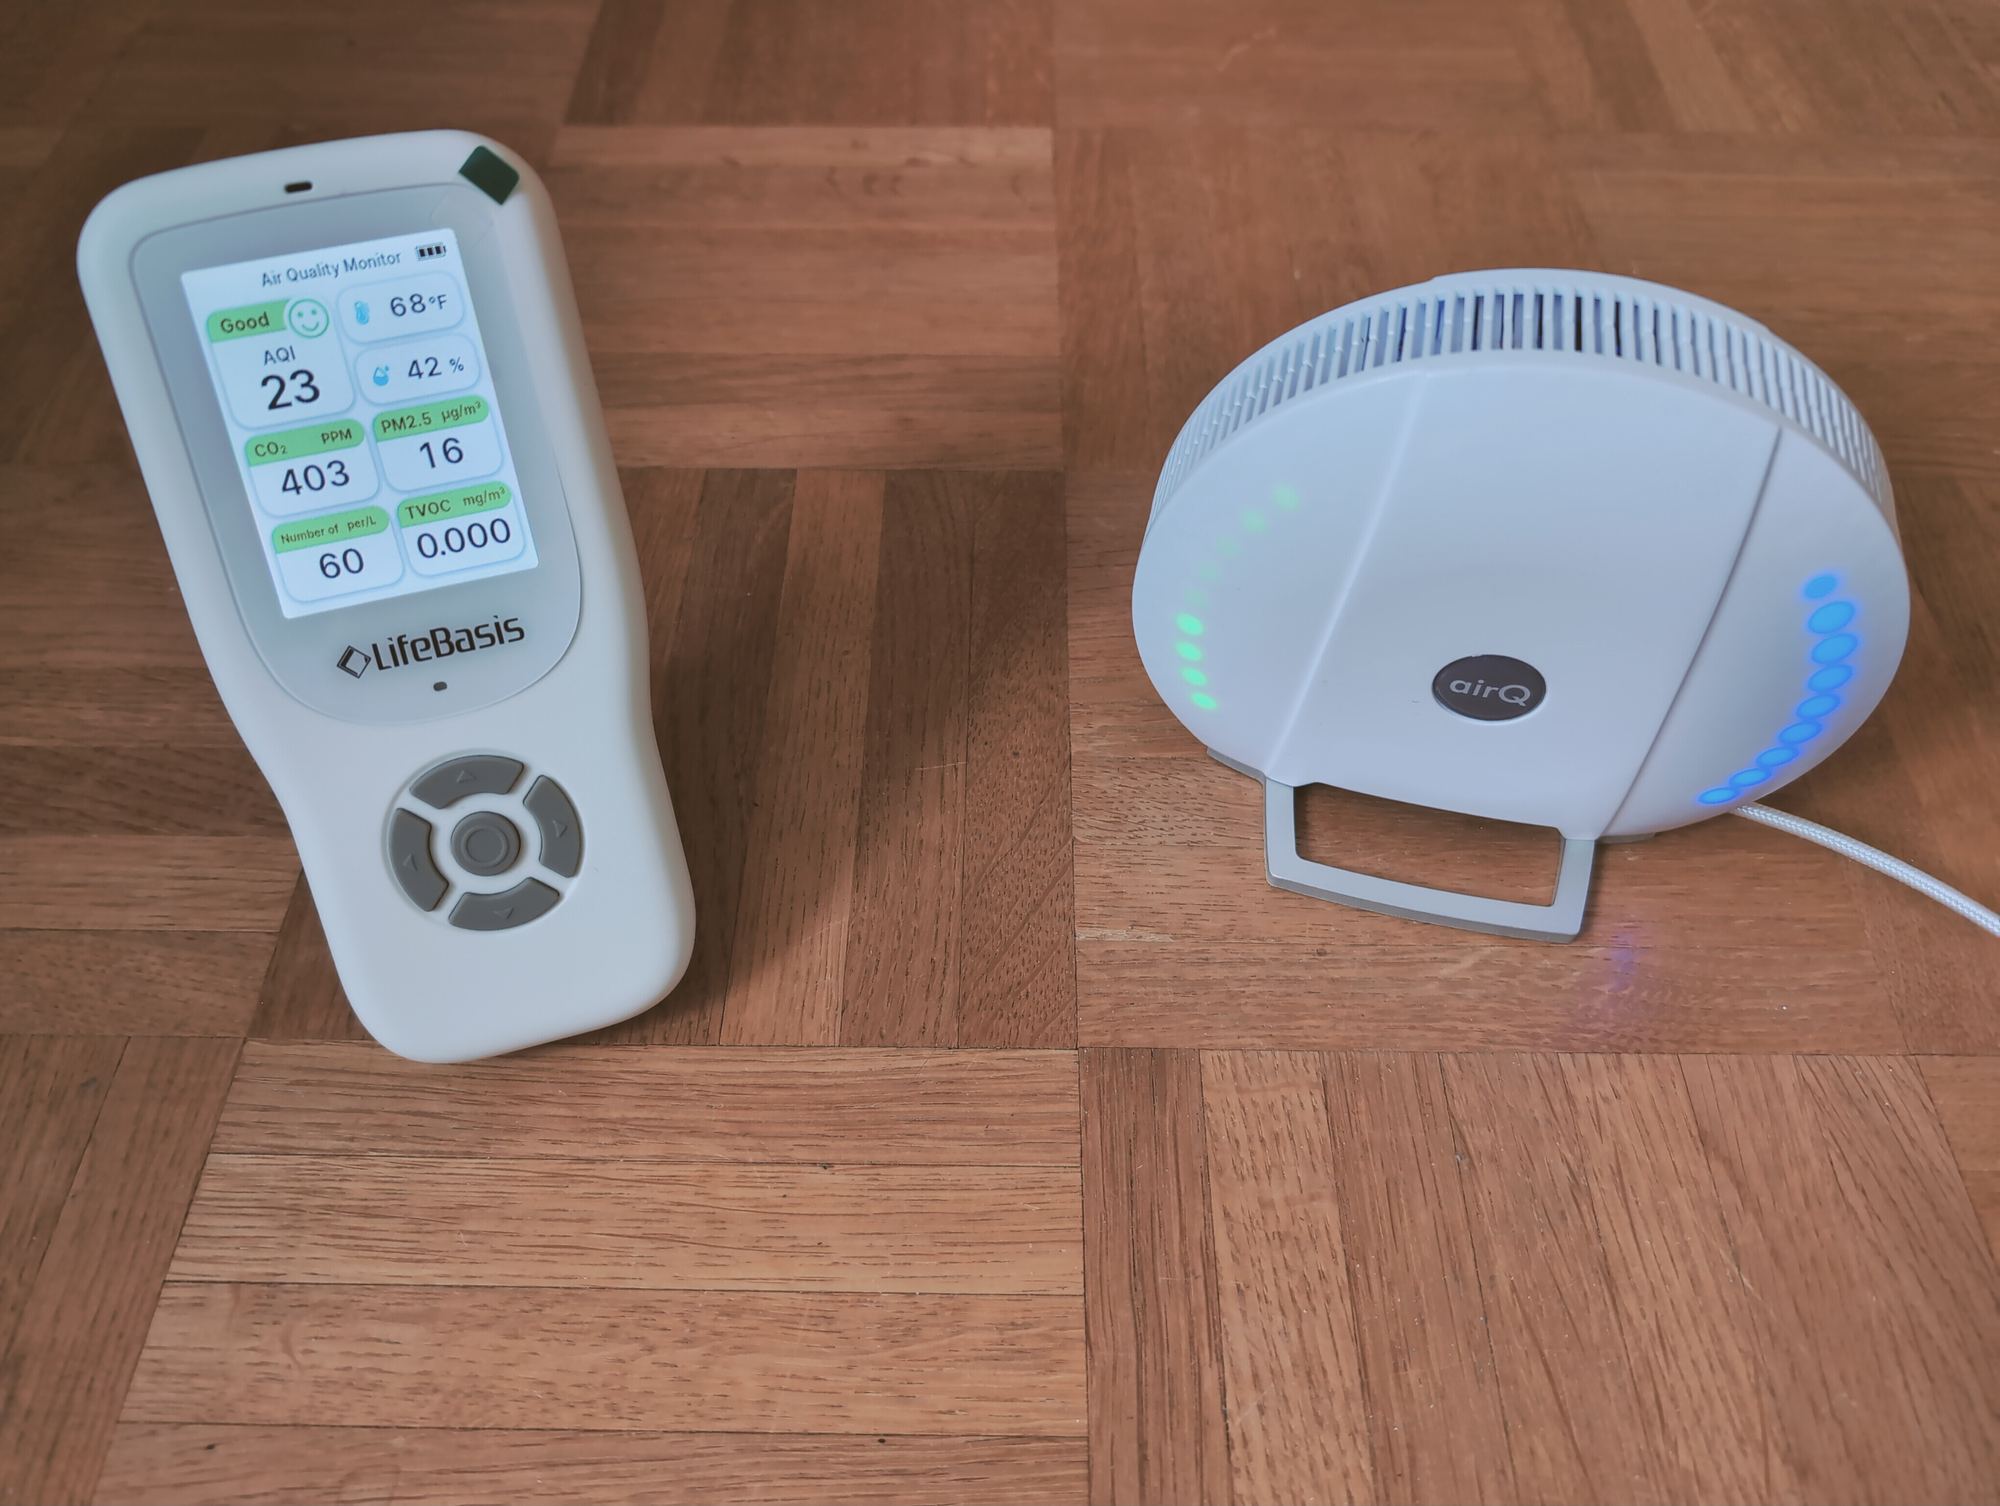
The LifeBasis monitor shows CO2 levels of 403 ppm, a PM 2.5 value of 16 μg/m³, and a total concentration of all volatile organic compounds (TVOC) at 0.000. It shows a humidity value of 42% and 68 degrees Fahrenheit, which converts to about 20 degrees Celsius.
Compare this to the air-Q:
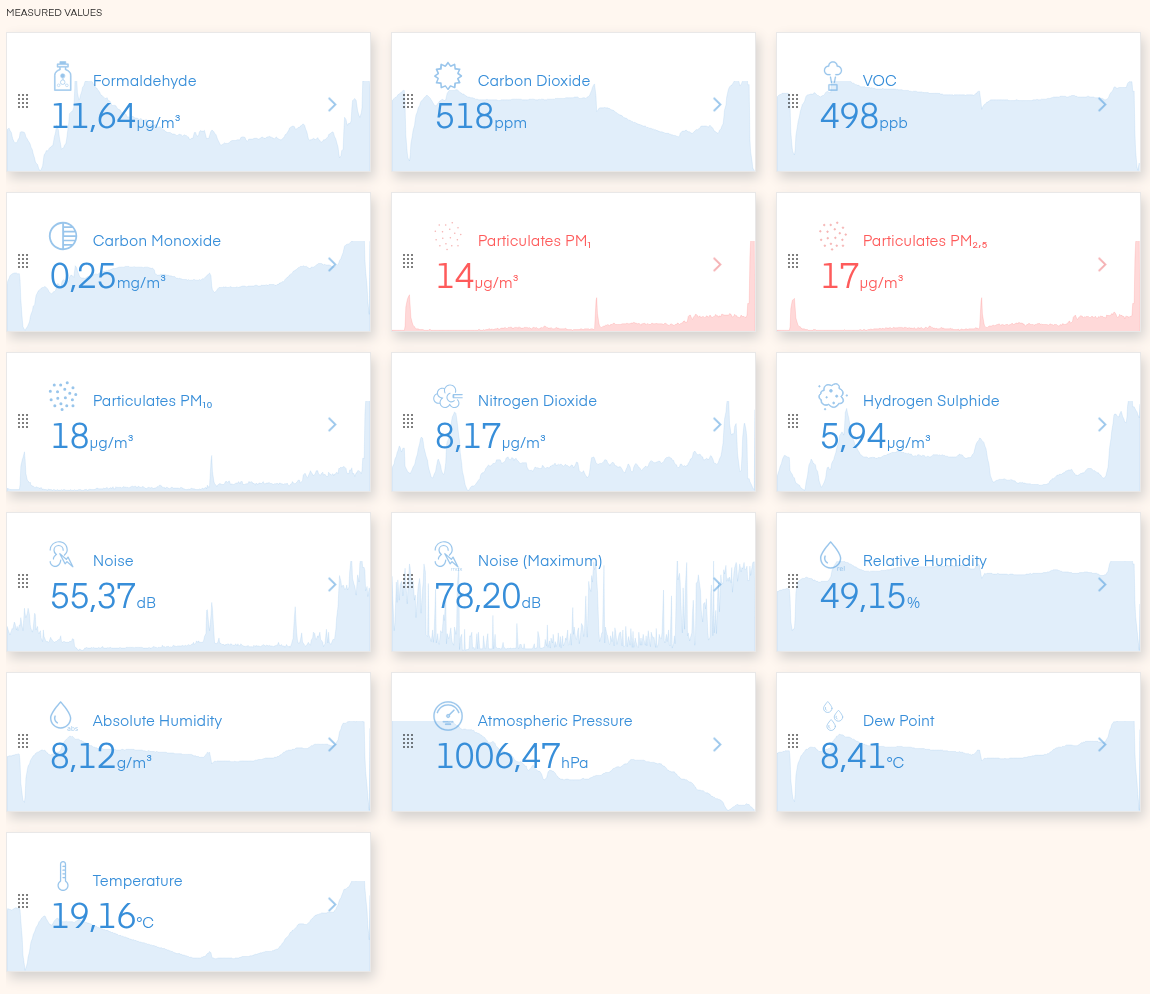
The air-Q dashboard shows CO2 levels of 518 ppm, a PM 2.5 value of 17 μg/m³, and a VOC value of 498 ppb (parts per billion). The latter is a lot more than 0. Humidity is at 49.15% and temperature at 19.16 degrees Celsius.
The LifeBasis monitor has two pages, so here's the second set of data:
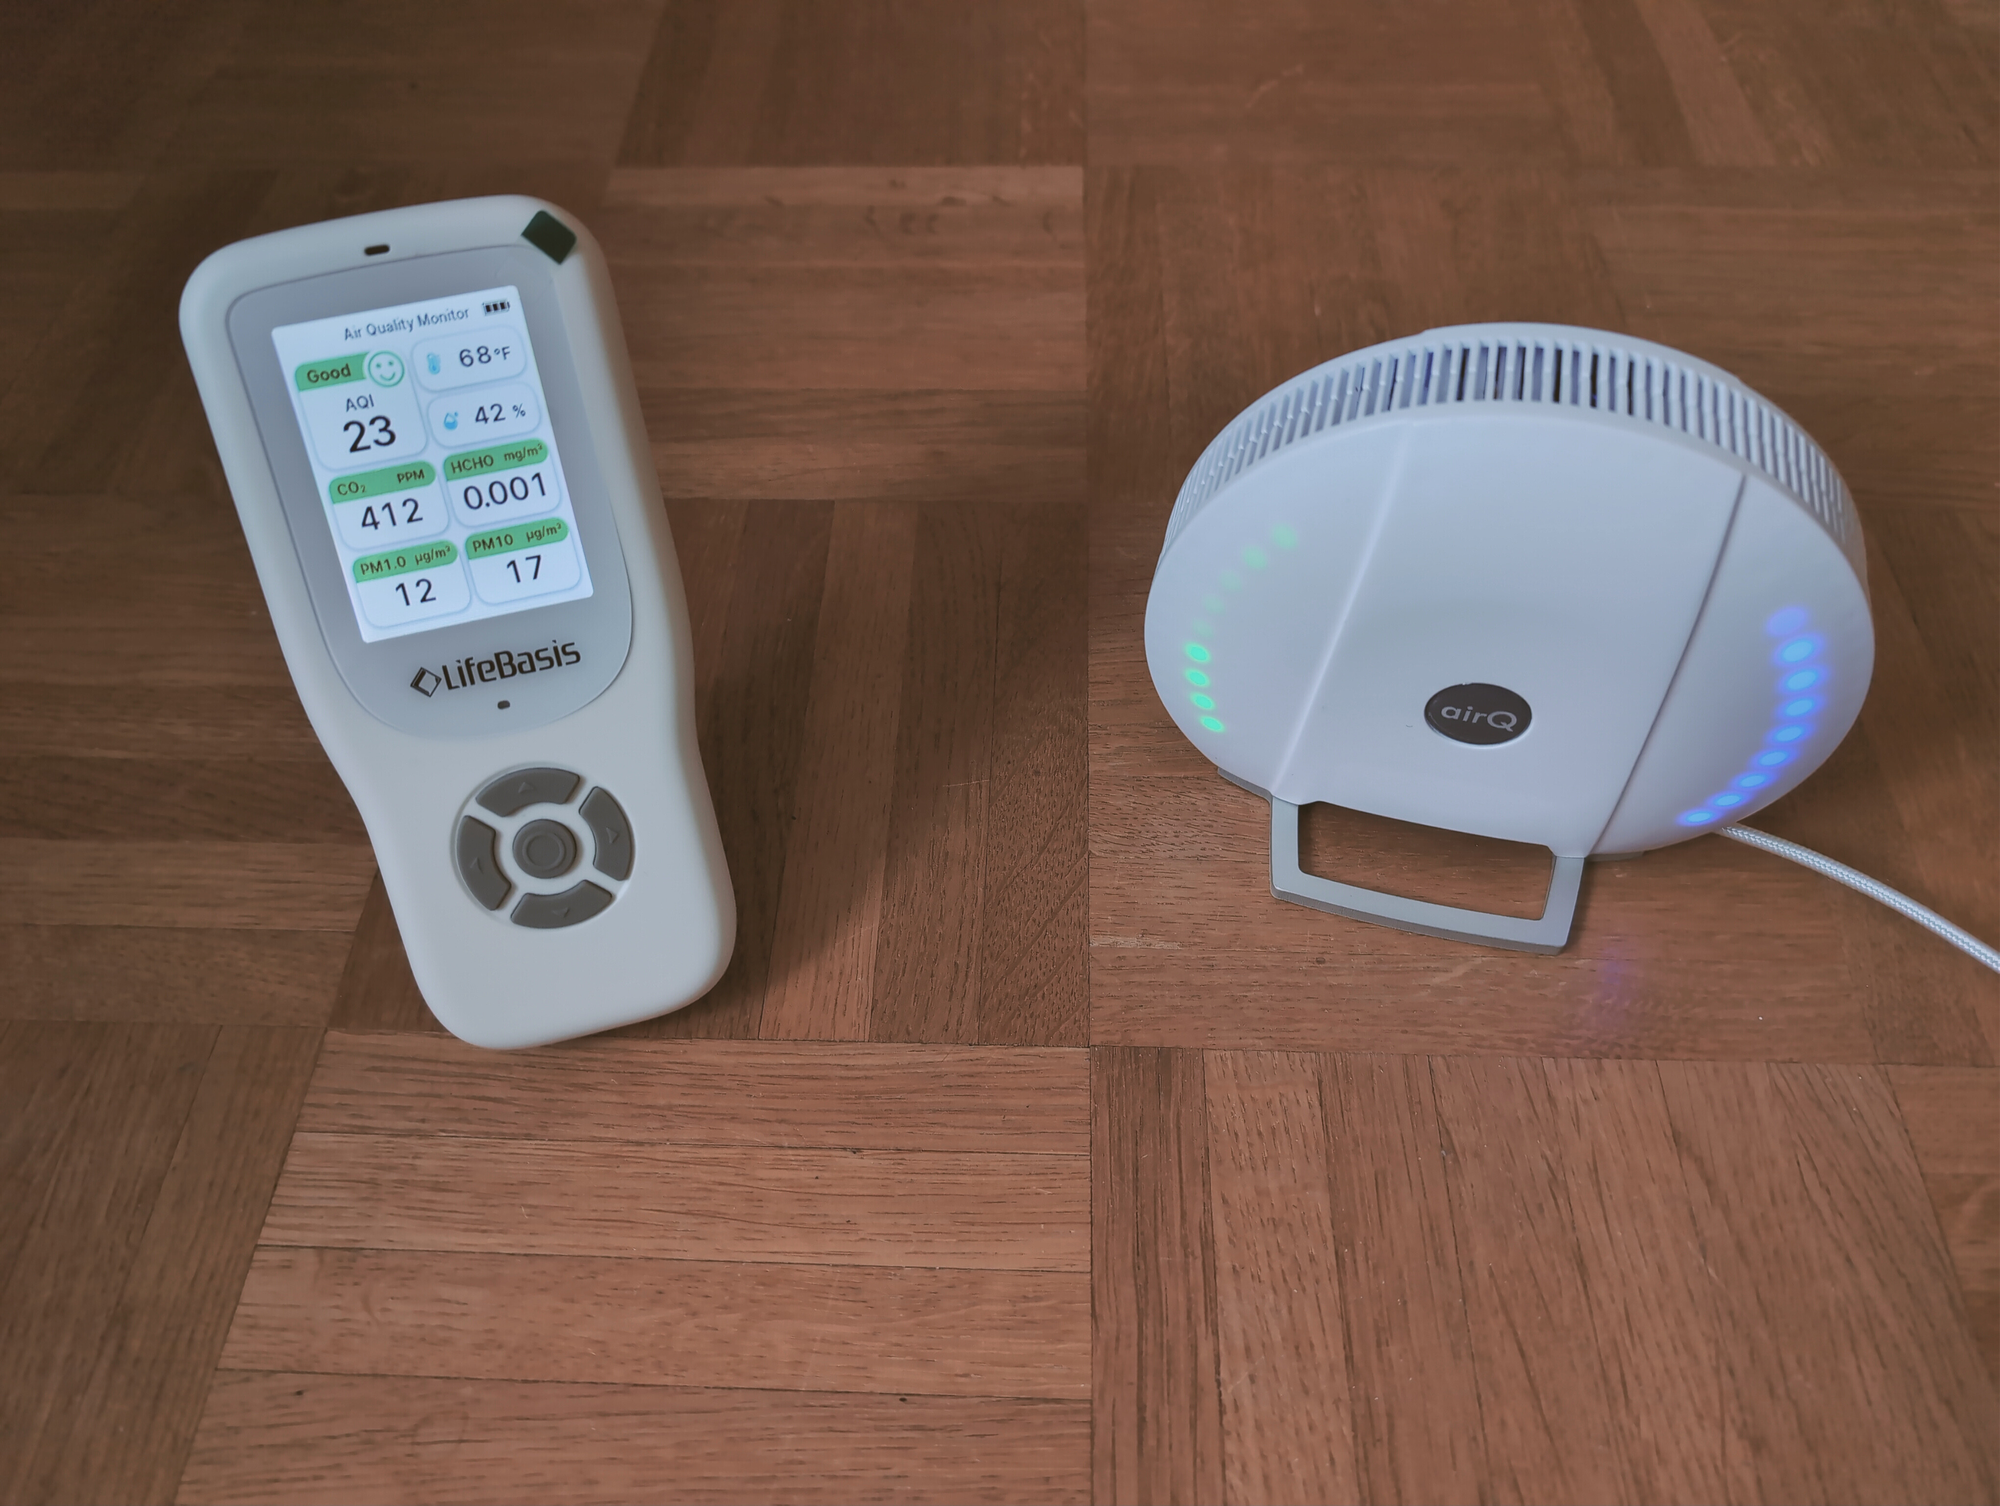
We see the values for temperature, humidity and CO2 as before, but now we also see:
- Formaldehyde (HCHO): 0.001 mg/m³
- PM 1: 12 μg/m³
- PM 10: 17 μg/m³.
A look at the air-Q dashboard above shows us the following values:
- Formaldehyde (HCHO): 11,64 μg/m³
- PM 1: 14 μg/m³
- PM 10: 18 μg/m³.
So formaldehyde is off because 11 μg/m³ (microgram per cubic meter) should convert to 0.011 mg/m³ (milligram per cubic meter). Measuring data for fine dust is pretty similar.
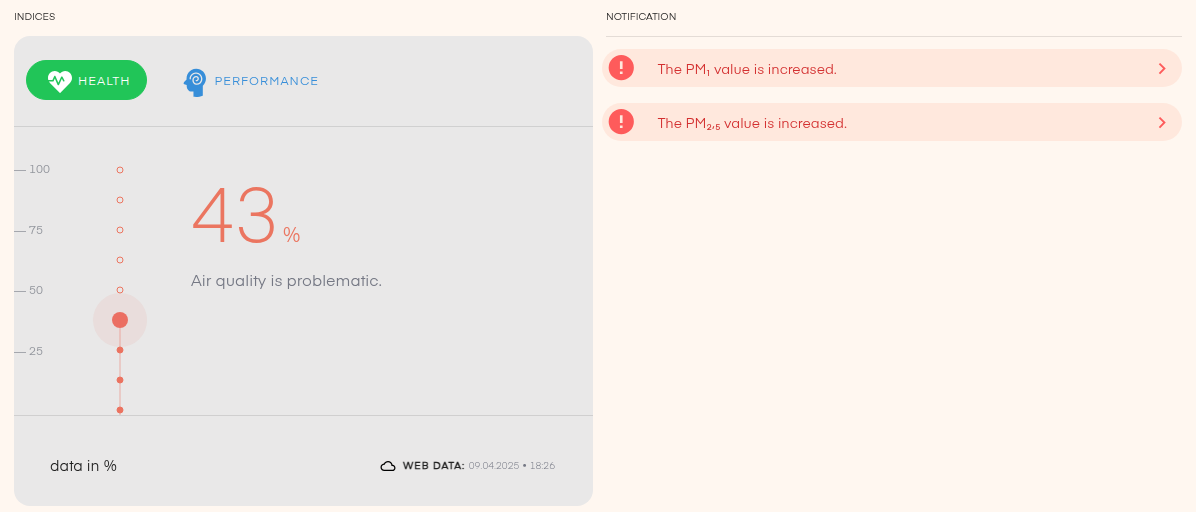
Note that the air quality index of IQ Air gives a rating of "moderate," while the LifeBasis monitor still smiles and says "Good". The air-Q shows two indices. The green one is the health index, and the blue one is the performance index, which is influenced by how much CO2 is in the air compared to fresh oxygen.
The air-Q complains faster about the overall air quality being problematic:
The verdict
I compared the devices on a few more occasions, but the behavior was very similar to this test. So what can we conclude?
Overall, the air-Q provides more data and is more precise in measuring. It also complains quicker about the air being bad. The red is a signaling color and evokes a certain emotional alert response.
The data from the IQ Air website gives a quick glance at what's outside but cannot take into account how the actual air in your rooms is, which can differ from street to street.
The LifeBasis air quality monitor is not as precise and doesn't have as many sensors as the air-Q, but can serve to get a quick estimate of the air quality.
So if you just need a rough estimate, taking a look at the IQ Air website is free, getting the LifeBasis devices gets you there for around 100 bucks, while the air-Q is the sophisticated option for nerds, that really want to know what's going on in their air, with prices ranging from 300 to 600 euros, depending on which sensors you want included in your device.